Plotting with GNUPlot#
When dealing with data either from simulations or from experiments, it’s often useful to get quick previews without having to write complete Python scripts using numpy/matplotlib. GNUPlot is a command line plotting tool that makes this very easy. One can also write complete plotting scripts in GNUPlot, but it can also be used directly from the command line without them.
Requirements/setup:
Install GNUPlot. On most Linux distributions, it is available from the default package manager. Others can download it from the website.
Have some data files you want to quickly plot/preview. An example data file is provided for you here.
Access to a terminal (available on all Mac/Linux distributions, for Windows, something like Power shell will do)
Let’s take a quick look at the contents of the file
$ head 00_gnuplot.dat
0.0     -0.065  -0.065  -0.065  -0.065  -0.065
5.0E-5  -0.065  -0.065  -0.065  -0.065  -0.065
1.0E-4  -0.065  -0.065  -0.065  -0.065  -0.065
1.5E-4  -0.065  -0.065  -0.065  -0.065  -0.065
2.0E-4  -0.065  -0.065  -0.065  -0.065  -0.065
2.5E-4  -0.065  -0.065  -0.065  -0.065  -0.065
3.0E-4  -0.065  -0.065  -0.065  -0.065  -0.065
3.5E-4  -0.065  -0.065  -0.065  -0.065  -0.065
4.0E-4  -0.065  -0.065  -0.065  -0.065  -0.065
4.5E-4  -0.065  -0.065  -0.065  -0.065  -0.065
The first column is time, the rest are membrane potentials for different cells. Let us plot the membrane potential for a few cells:
$ gnuplot -p -e "set xlabel 'time (s)'; set ylabel 'v (volt)' ;\
    plot '00_gnuplot.dat' using 1:2 with lines title 'cell1'"
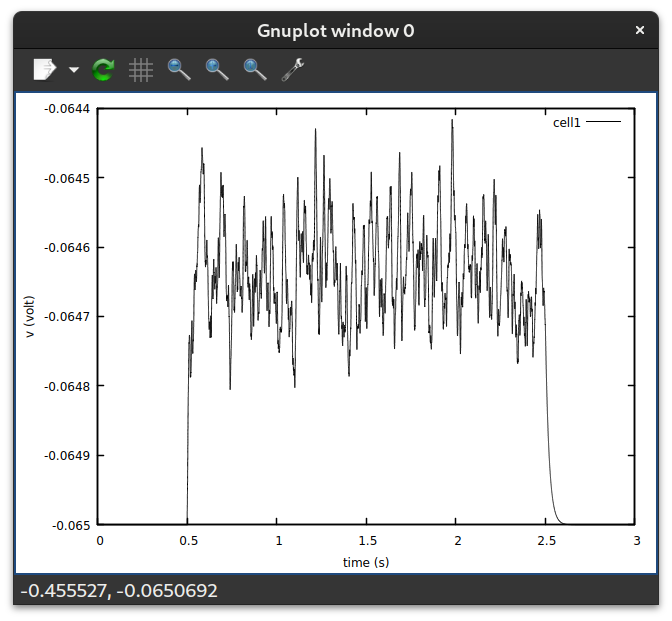
This will pop up a window like this:

You can use the controls to zoom in, out, or to save the figure to a file. Explanation of options and commands:
-pmakes the GNUPlot window persist until closed by the user-eexecutes the provided commandsthe
usingkey word is used to select columns to plotwith linestells GNUPlot to plot using linestitlesets the title for this plot
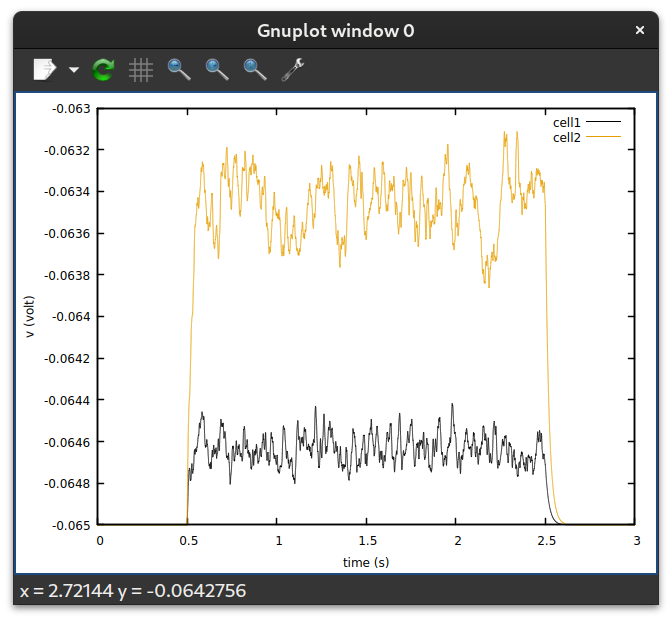
To plot multiple columns, one can use this:
$ gnuplot -p -e "set xlabel 'time (s)'; set ylabel 'v (volt)' ;\
    plot '00_gnuplot.dat' using 1:2 with lines title 'cell1',\
    '' using 1:3 with lines title 'cell2'"

Here, the empty quotes implies that the same file should be used.
GNUPlot has lots of advanced options such as exporting to LaTeX, statistics, for loops, multi-plots, and so on. Please check the references for more information.
References